Using Avero Data to Project Sales Volume
Operating a restaurant in the era of Covid-19 is a level-10 challenge. One of the biggest factors making it so difficult is the seemingly impossible task of correctly projecting sales volume and customer traffic. Your projected sales volume determines how much product to order and prep and how many workers to schedule. Miscalculation can leave you with too little resources to meet demand, and hence missed sales. Perhaps more commonly these days, it can also lead to loss in the form of waste and unnecessary labor costs.
Now more than ever, restaurant operators need data to help guide these important decisions. Avero has a variety of tools to help. In this article, we’ll dive into some simple ways to leverage Avero data to gauge your customer and sales volume.
Supplementing YoY Reporting
Under normal circumstances, looking at year-over-year (YoY) sales can help you forecast sales for a given period. The Covid-19 pandemic has made that metric somewhat unreliable since sales tanked in March and have not yet recovered.
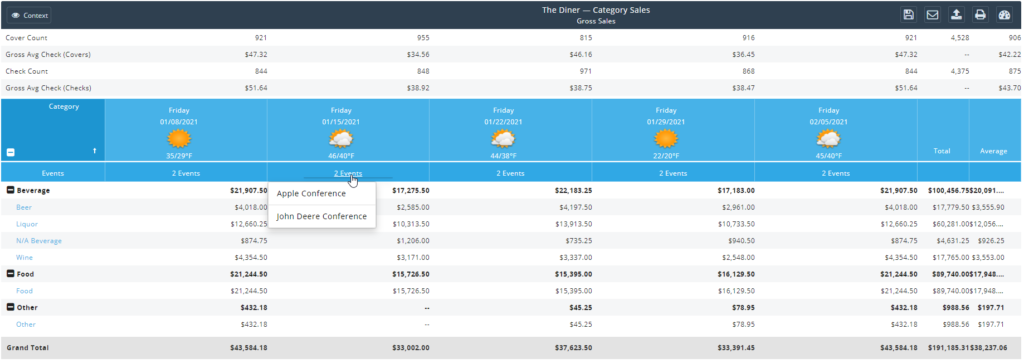
Asking “how have my sales been lately” is a better question for the moment. The answer can be found in a Trend Report. Trend reports compare a particular day or period side by side, with additional context like weather and events. It even includes a sales average for the included days.
Running a Trend Report
To create a trend report, go to the report generator. Select the business, the revenue center(s) to include, and the meal period(s). In the Date field, select Trend. You can view the past 10 days or compare the past 10 Fridays to better understand your upcoming weekend volume. You’ll see the sales totals, by major category (Food/Beverage/Other), for each day, as well as the average.

Comparing a particular day of the week can be helpful. Use that option to gain a better understanding of how customer traffic is fluctuating throughout the week. Plus, you’ll see that day’s weather forecast listed as well. If you’re looking at 10 Fridays, and notice that sales are higher on cloudy days, you can infer which type of performance you’re likely to have this Friday based on the upcoming weather forecast.
Pinpointing Relevant Time Periods
In the current environment, the weather is only one of several fluctuating factors that impact customer traffic. Covid-19 outbreaks and their associated business regulations are perhaps the greatest factor in fluctuating restaurant traffic today.
2020 was a rollercoaster of rising and falling sales—a pattern that continues into 2021. Despite the constant fluctuations, it is possible to see some correlation between Covid-19 regulations and restaurant sales that can help with your planning process. One method is to identify a date range when your restaurant was operating under similar regulations as you are now.
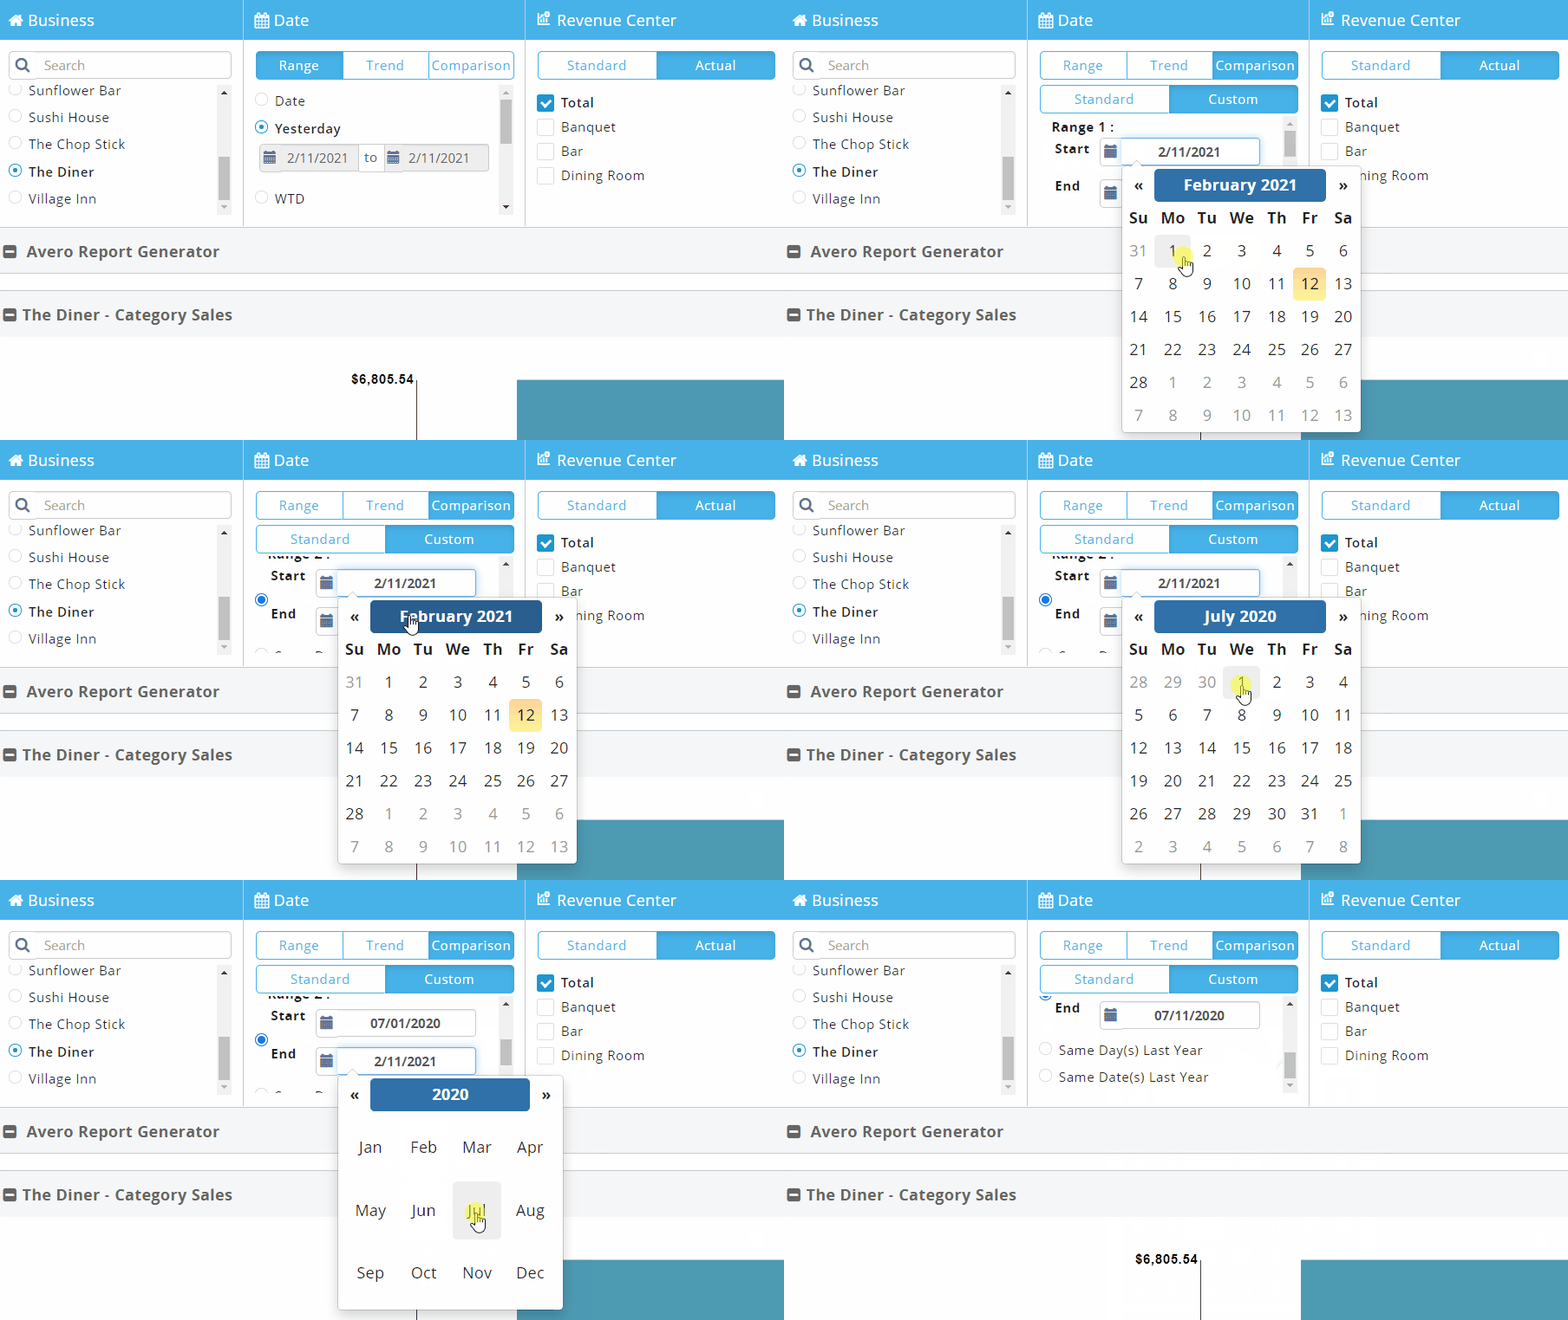
For example, indoor dining in Chicago has been closed for the past two months. Regulations have recently relaxed to allow indoor dining at 25% capacity in restaurants and bars. A restaurant in the Chicago area needed to estimate their projected sales so they could staff and order appropriately in preparation for reopening. The last time Chicago capped indoor dining at 25% was in late June. That threshold remained until October when it increased to 40%. For this restaurant, looking at sales volume during a date range between July and October is going to be more relevant for them than looking at the past 7 weeks, while indoor dining has been prohibited.
They can even run a comparison report that puts sales during a week in July side by side with last week’s sales to see exactly how they stack up. As new Covid cases decline and restaurant regulations fall further, allowing 40% dining capacity indoors, this restaurant can use a comparison report to look at data from October to December to guide their preparation.
Benchmarking Against the Avero Index
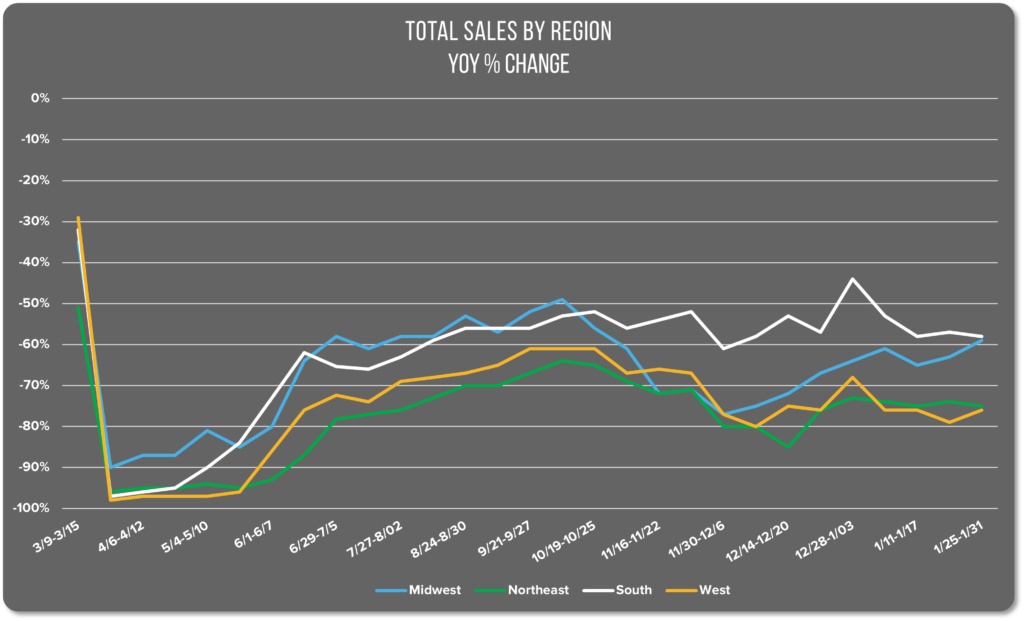
Another way restaurants leverage Avero data to project their sales volume is by looking at the Avero Index data we publish weekly on our blog. In addition to the national index data, we provide restaurant sales data by region. This is particularly helpful since the spread of Covid-19 has waxed and waned depending on region.
Take a look at the Total Sales by Region chart from the Index below. Follow the blue line indicating the ebb and flow of sales in the Midwest. We can see that sales have been rising in 2021. The most recent data shows sales at a similar level as they were in July. From July, sales fluctuate but increase overall until the fall when the local infection rate was surging, leading to closure again by December. Combining this trend with a restaurant’s actual sales totals during the same period will give that restaurant a better sense for what they might expect going forward.
Staffing to Fluctuating Demand
Projecting sales volume is only one aspect of preparing appropriately for upcoming periods. The Covid-19 pandemic is also driving fluctuations between indoor dining, outdoor dining, and takeout/delivery that can make it difficult to staff appropriately. If you’re likely to sell 50 hamburgers today, your past experience will help inform the level of kitchen staff necessary to prepare 50 hamburgers. But what portion of those will be eaten on the premises, requiring service? That is a trickier question in 2021.
Avero can answer that question for you, as long as your POS is set up to track order types. Creating distinct Order Modes will allow you to filter your sales reports to look at only dine-in volume for staffing service and delivery/takeout volume when staffing the kitchen.
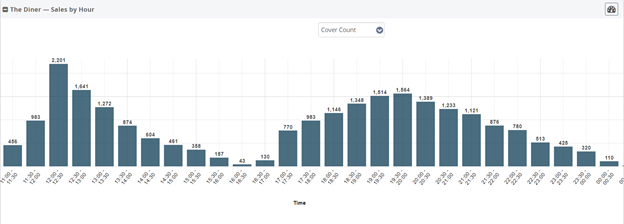
In addition to projecting sales volume, you will also want to know whether you will be serving the bulk of those burgers during the day, or on your evening shift? Will orders taper off after 7:00 pm? Or do you need to keep staff on full blast until 10:00 pm? To answer that question, it’s helpful to look at the Sales by Hour report under the Revenue Management tab. In this view, you’ll see sales volume at the time items were entered into the POS. Using this tool will allow you to adjust the start and end times of your shifts. Or you could stagger the in-times of employees to match the need and reduce wasted employee hours.
Keep in mind that these are just a few suggestions for how you can leverage Avero to gauge sales volume and plan for the days ahead. Avero provides a lot of different ways to optimize employee schedules and limit wasted food and employee labor hours. You can find additional resources to aid your scheduling and planning in our knowledge base.

